
Does the EU SOC/clay (1/13) soil-health indicator work on heavy soils? Evidence from 42 profiles in North Bulgaria
Abstract
Background. The EU Soil Monitoring Law (Directive (EU) 2025/2360) lists a soil organic carbon to clay ratio (SOC/clay) above 1/13 as a criterion of healthy mineral soils. The threshold was derived mainly from temperate soils of moderate clay content, and its behaviour on very heavy soils is poorly known.
Methods. We tested the criterion on 42 topsoil profiles (first horizon, 27–33 cm) selected on purpose in an area of North Bulgaria dominated by heavy, clay-rich soils (median clay 46.5 %). SOC was derived from Tyurin humus (SOC = 1.15 × humus / 1.724) and clay (<0.002 mm) was measured directly in 40 profiles and estimated from Kachinsky fractions in two. Soils were assigned to FAO soil units (25 Haplic Chernozems, 14 calcari-eutric Regosols, 3 Haplic Luvisols). We report pass rates with exact confidence intervals, group comparisons with non-parametric tests, and a sensitivity analysis of the SOC conversion.
Results. No profile met the criterion (0 of 42; 95 % CI 0–8.4 %). The median SOC/clay was 0.040 against a threshold of 0.0769, and the best profile reached 0.066. SOC/clay did not differ between FAO units (Kruskal–Wallis p = 0.66). The median profile would need about 1.9 times its corrected SOC; a 1.5-fold increase lets two profiles pass.
Conclusions. On these heavy soils, including Chernozems, a single threshold of 1/13 classifies all profiles as failing, regardless of soil unit and plausible SOC conversion. The result cannot separate real structural vulnerability from a threshold, sampling-depth or conversion effect. Recommendation is testing on lighter soils in the same country, adding structure measurements, and considering soil-unit-specific reference values.Keywords: soil organic carbon; SOC/clay ratio; Soil Monitoring Law; soil health indicator; Chernozems; clay-rich soils; Bulgaria; soil structure.
1 Introduction
The Soil Monitoring Law, Directive (EU) 2025/2360 (European Parliament and Council, 2025), requires Member States to monitor soil health by common descriptors and criteria. For mineral soils, one criterion in Annex I, Part A is a ratio of soil organic carbon to clay content (SOC/clay) above 1/13; soils below it are to be considered unhealthy with respect to carbon and structure. Monitoring is organised by soil districts and soil units, with first measurements due in 2030.
The ratio goes back to Dexter et al. (2008), who proposed that a SOC/clay ratio near 1/10 corresponds to complexation of clay by organic matter and to good soil physical properties in French and Polish soils. Johannes et al. (2017) related SOC/clay to visual and physical structure quality in 161 Swiss arable topsoils (5–10 cm) and proposed thresholds of 1/8, 1/10 and 1/13 for very good, good and moderate structure, with soils below 1/13 considered degraded. Prout et al. (2021) applied the thresholds to 3,809 topsoils (0–15 cm) from England and Wales and found that arable land was most often in the low classes.
The indicator is contested. Poeplau and Don (2023) analysed 2,958 German agricultural topsoils and concluded that the ratio is biased by clay content: 97 % of Vertisols and 61 % of Chernozems fell into the degraded class, and the ratio separated bulk density poorly. Mäkipää et al. (2024) applied the 1/13 threshold to about 21,900 LUCAS topsoil points; Vertisols were the most degraded class, and the authors judged a single threshold unsuitable across climates and land uses. Sauzet et al. (2024) replied that the ratio measures vulnerability of soil structure, not a SOC level, and that thresholds for some soils (Andosols, Vertisols, Chernozems, peat, chalky soils) may need tailoring. Johannes et al. (2023) found, in 96 Swiss Jura fields with 16–52 % clay, that reaching the ratio was no harder at high clay content and that management mattered more than texture.
Three gaps remain. First, heavy soils with 40–55 % clay and more are under-represented in the datasets on which the thresholds were set and tested. Second, data from Southeast Europe are scarce; furthermore, the soil data for Bulgaria used in this article are based on historical national methods (Tyurin humus, Kachinsky particle-size fractions) that must be converted to the international definitions used in the Directive. Third, the effect of soil unit within a uniformly heavy area has not been investigated.
The 1/13 criterion was tested on 42 topsoil profiles from an area of North Bulgaria chosen for its heavy, clay-rich soils. This is the second of two tests by the same author; the first, on 87 profiles of Vertisols in south-central Bulgaria, was published as a web article (Yordanov, 2026). The second set is independent of the first. Our aims were (i) to determine the share of profiles passing 1/13; (ii) to compare SOC/clay between FAO soil units; (iii) to test sensitivity of the result to the SOC conversion; and (iv) to discuss whether the criterion needs local or general adjustment for heavy soils.
2 Materials and methods
2.1 Study area and climate
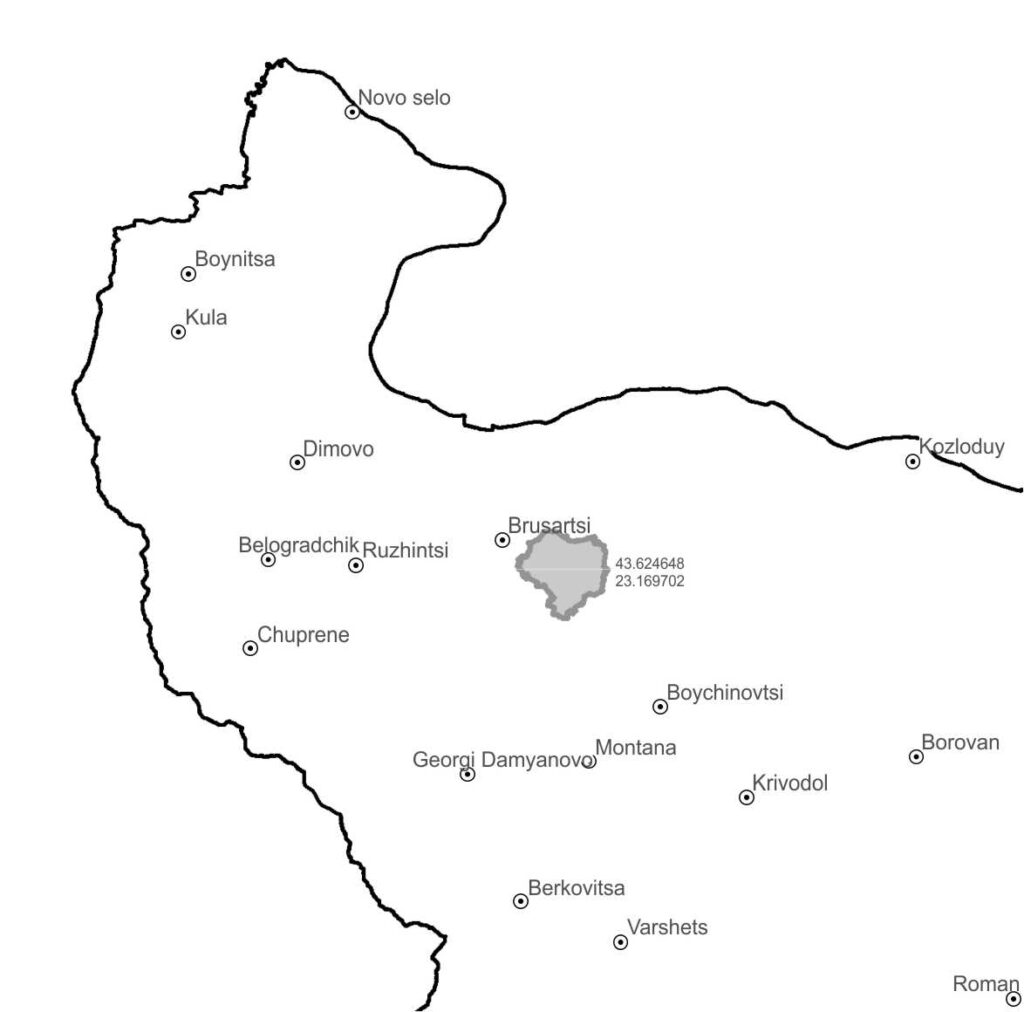
The study area is a municipality in North Bulgaria near the village of Medkovec, Montana district, at a mean altitude of 182 m.
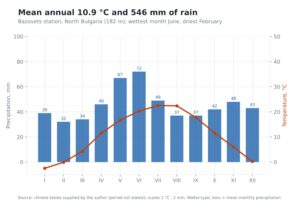
Climate data come from the Bazovets station with averaging period of 30 years and 30 km East from the study area . Mean annual air temperature is 10.9 °C (January −2.5 °C, July 22.5 °C) and mean annual precipitation is 546 mm, with maxima in May and June (67 and 72 mm). The period with stable temperatures above 10 °C lasts 196 days with a temperature sum of 3,560 °C·days. The De Martonne index, P/(T + 10), is 26.1 and the Lang rain factor, P/T, is 50.1; by the Walter criterion (P < 2T) only August is dry. These indices were calculated from the station tables. The monthly course is shown in Figure 2.
2.2 Soil data
Forty-two soil profiles were selected in areas where very heavy, clay-rich soils predominate, in order to test the indicator under stress. Historical data for each profile has one record of the first horizon (thickness 27–33 cm, median 30 cm) with humus content, pH (water), particle-size fractions and horizon description.
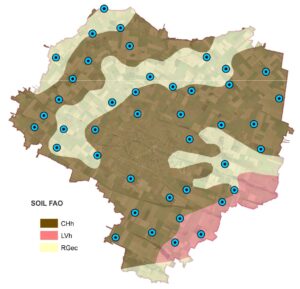
Each profile was assigned a FAO soil unit from the soil map of the area: Haplic Chernozems (CHh, n = 25), calcari-eutric Regosols (RGec, n = 14) and Haplic Luvisols (LVh, n = 3). The unit comes from the map unit in which the profile falls and not from an independent classification of the profile, so it may differ from the profile’s own classification.
2.3 Conversion to the definitions used in the Directive
Humus was determined by the Tyurin method. SOC was calculated as
SOC = f × humus / 1.724, with f = 1.15,
where 1.724 is the Van Bemmelen factor and f is a recovery correction for the incomplete oxidation of Tyurin wet digestion (literature range 1.0–1.15) [Shamrikova et al. (2022)]. The Directive refers to dry combustion (ISO 10694); no parallel dry-combustion measurements were available.
Clay (<0.002 mm) was measured directly on the international scale in 40 profiles. In two profiles only Kachinsky fractions were available, and clay was estimated as
clay = F(<0.001 mm) + 0.43 × F(0.001–0.005 mm),
where F is the content of a fraction in %. The alternative coefficient of 0.25 (Sadovski and Ivanova, 2020) lowers the estimate by about 2–2.5 percentage points. Both are interpolations, not measurements. The criterion is
R = SOC / clay > 1/13 = 0.0769.
2.4 Statistical analysis
The share of profiles passing was reported with an exact (Clopper–Pearson) 95 % confidence interval (Clopper and Pearson, 1934) and the median with a percentile bootstrap 95 % interval. Associations used Spearman rank correlation (Spearman, 1904) and ordinary linear regression of SOC on clay. FAO units were compared with the Kruskal–Wallis test (Kruskal and Wallis, 1952) and, for the two large groups, the Mann–Whitney test. Sensitivity of the pass rate to the SOC conversion was assessed by applying multipliers from 1.0 to 2.8 to the corrected SOC. The multiplier needed by each profile was 1/13 divided by its ratio. Significance was set at α = 0.05. Calculations and figures were produced in Python (SciPy, matplotlib). With n = 3, results for Luvisols are descriptive only.
2.5 Mapping
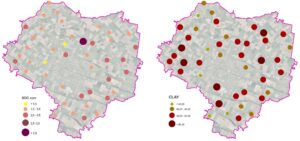
Profile values and the FAO soil map were displayed in a GIS (Figure 1)
3 Results
3.1 Descriptive statistics
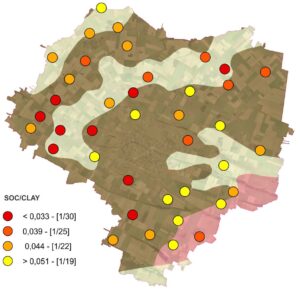
The profiles are heavy and moderately humic: median clay is 46.5 % and median SOC 1.81 % in the first horizon (Table 1). Figure 1 shows the profile values of SOC, clay, FAO unit and SOC/clay on the study area.
|
Variable |
Median |
Range |
|
Clay <0.002 mm, % |
46.5 |
37.9–53.2 |
|
Humus (Tyurin), % |
2.72 |
1.73–4.69 |
|
SOC (1.15 × humus / 1.724), % |
1.81 |
1.15–3.13 |
|
pH (water) |
6.25 |
5.1–7.8 |
|
SOC/clay |
0.040 |
0.026–0.066 |
3.2 Share of profiles passing 1/13
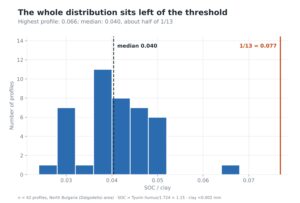
None of the 42 profiles reached the threshold of 0.0769 (pass rate 0 %, exact 95 % CI 0–8.4 %). The median ratio was 0.040 (bootstrap 95 % CI 0.039–0.043), about 52 % of the threshold, and the best profile, a Regosol, reached 0.066, 14 % below it (Figure 3). The median profile would need about 3.6 % SOC, 1.9 times its corrected value.
3.3 SOC and clay
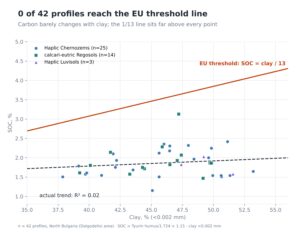
SOC was almost independent of clay (linear R² = 0.02; Figure 4), so the ratio decreased as clay increased (Spearman ρ = −0.34, p = 0.03). Clay ranged over only 15 percentage points, which limits what can be said about the slope.
3.4 FAO soil units
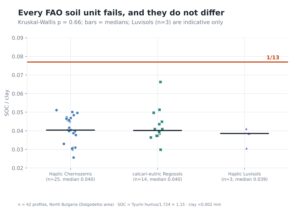
The three FAO units did not differ in SOC/clay (Kruskal–Wallis p = 0.66), humus (p = 0.83) or clay (p = 0.24); Chernozems and Regosols also did not differ in SOC/clay (Mann–Whitney p = 0.90). No profile passed in any unit (Table 2, Figure 5).
| FAO soil unit | n | Clay, % (median) | Humus, % (median) | SOC/clay (median) | SOC/clay (range) | Pass | Uplift needed (median) |
| Haplic Chernozems (CHh) | 25 | 46.0 | фев.63 | 0.0404 | 0.026–0.051 | 0 | ×1.90 |
| calcari-eutric Regosols (RGec) | 14 | 46.2 | фев.76 | 0.0402 | 0.030–0.066 | 0 | ×1.91 |
| Haplic Luvisols (LVh) | 3 | 49.2 | фев.74 | 0.0386 | 0.031–0.041 | 0 | ×1.99 |
3.5 Sensitivity to the SOC conversion
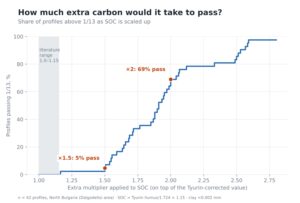
Without the Tyurin recovery correction (f = 1.0) no profile passed. Multiplying the corrected SOC by 1.5 lets 2 of 42 profiles pass, and by 2.0 lets 29 of 42 pass (Figure 6). Expressed as a Tyurin factor f, the median profile would need about 2.2, and 28 of 42 profiles would need more than 2, against a literature maximum of 1.15. The result is therefore not an artefact of the conversion.
3.6 Spatial pattern
On the maps (Figure 1) the lowest ratio class (<0.033) appears mainly in the west of the area and the highest class (>0.051) mainly in the south and east, but the highest class is still far below 1/13. We did not test spatial autocorrelation.
4 Discussion
4.1 Main finding
On 42 profiles from an area of very heavy soils, the SOC/clay criterion of 1/13 classified every profile as failing. The result holds in each of the three FAO units, which did not differ, and it is not removed by any plausible change in the SOC conversion: even a Tyurin factor at the upper literature value of 1.15 leaves the median ratio at about half of the threshold.
4.2 Comparison with other datasets
The direction agrees with the larger European datasets, though the Bulgarian result is more extreme. In Germany, 61 % of Chernozems and 97 % of Vertisols were in the degraded class (Poeplau and Don, 2023), and in LUCAS Vertisols were the most degraded class while 70.9 % of all mineral soils passed (Mäkipää et al., 2024). In the Swiss Jura, by contrast, clayey fields with 16–52 % clay reached the thresholds under favourable management (Johannes et al., 2023), which overlaps our clay range (38–53 %). A high clay content alone therefore does not make the threshold unattainable.
Several factors may explain why none of our profiles passed, and our data cannot separate them. (i) Sampling depth: the first horizon here is 27–33 cm, whereas thresholds were derived on 5–10 cm (Johannes et al., 2017) and tested on 0–15 cm (Prout et al., 2021) layers; SOC usually declines with depth, so a thicker layer gives a lower mean SOC and a lower ratio. (ii) Method: Tyurin humus converted with a literature factor may differ from dry-combustion SOC, which we could not check. (iii) Land use and management: arable land is most often in low classes (Prout et al., 2021; Mäkipää et al., 2024), and land use of the profiles was not recorded. (iv) Climate: warm, relatively dry areas show more soils below 1/13 in LUCAS (Mäkipää et al., 2024). (v) The threshold itself, which was set on different soils.
4.3 What the ratio tells us on heavy soils
Poeplau and Don (2023) read results like ours as clay bias of the indicator; Sauzet et al. (2024) read the ratio as a measure of structural vulnerability that need not track a SOC level and argue that the thresholds should be reassessed from structure quality, not from SOC distributions. Our data, without structure measurements, cannot decide between these readings. The distinction matters in practice: if the ratio is biased on heavy soils, a uniform threshold would classify most of them as unhealthy without cause; if it is valid, the soils are structurally vulnerable and need management response.
Three tests would separate the readings: (a) measuring structure (bulk density, visual evaluation of soil structure) on a subset of profiles and relating it to the ratio within heavy soils; (b) sampling reference sites under permanent grassland or forest on the same soil units: if they also fall below 1/13, the threshold is unreachable for these soils; if they pass, the gap is a management effect; (c) comparing the classification with the SOC to expected SOC metric of Poeplau and Don (2023).
4.4 Implications for monitoring under the Directive
The equal outcome in all three units means that soil unit alone does not rescue the criterion here, so unit-specific thresholds would need reference values and not only a relabelling. A first practical step is to specify the sampling depth for the SOC/clay criterion, a gap also noted by Sauzet et al. (2024), and to state the SOC method and conversion explicitly, because both change the ratio by amounts comparable to the distance to the threshold.
4.5 Limitations
The study covers one area and 42 profiles; Luvisols (n = 3) allow no inference; the profiles were selected for heaviness, so they say nothing about lighter soils; clay range is narrow (38–53 %); the FAO unit is taken from a soil map and not from a profile classification; the Tyurin factor is a literature value, not a local calibration; clay in two profiles is estimated; land use, management and structure were not recorded; and the climate station may not represent the whole area.
5 Conclusions and recommendations
In an area of North Bulgaria with very heavy soils (median clay 46.5 %), none of 42 topsoil profiles met the Soil Monitoring Law criterion of SOC/clay > 1/13 (95 % CI of the pass rate 0–8.4 %), and the result was the same in Haplic Chernozems, calcari-eutric Regosols and Haplic Luvisols.
- The median ratio (0.040) is about half of the threshold; the median profile would need about 1.9 times its corrected SOC, which exceeds the range of plausible conversion factors.
- The data cannot show whether this reflects real structural vulnerability or a threshold, depth or method effect, because no structure measurements are available.
- The profiles were chosen for heaviness, so the result should not be extended to lighter soils; testing in less clay-dominated areas of Bulgaria is the next step.
Recommendations: (a) specifying sampling depth and the SOC method for the criterion; (b) testing, on heavy soils, whether the ratio predicts measured structure; (c) sampling reference sites on the same soil units to see whether 1/13 is attainable; and (d) considering soil-unit-specific or expected-SOC-based reference values before the criterion is applied to heavy soils.
References
Clopper, C. J., & Pearson, E. S. (1934). The use of confidence or fiducial limits illustrated in the case of the binomial. Biometrika, 26, 404–413.
Dexter, A. R., Richard, G., Arrouays, D., Czyż, E. A., Jolivet, C., & Duval, O. (2008). Complexed organic matter controls soil physical properties. Geoderma, 144(3–4), 620–627.
European Parliament and Council (2025). Directive (EU) 2025/2360 of 12 November 2025 on soil monitoring and resilience (Soil Monitoring Law). Official Journal of the European Union. https://eur-lex.europa.eu/eli/dir/2025/2360/oj
IUSS Working Group WRB (2022). World Reference Base for Soil Resources. International soil classification system for naming soils and creating legends for soil maps. 4th edition. International Union of Soil Sciences, Vienna.
Johannes, A., Matter, A., Schulin, R., Weisskopf, P., Baveye, P. C., & Boivin, P. (2017). Optimal organic carbon values for soil structure quality of arable soils. Does clay content matter? Geoderma, 302, 14–21. https://doi.org/10.1016/j.geoderma.2017.04.021
Johannes, A., Sauzet, O., Matter, A., & Boivin, P. (2023). Soil organic carbon content and soil structure quality of clayey cropland soils: A large-scale study in the Swiss Jura region. Soil Use and Management, 39(2), 707–716. https://doi.org/10.1111/sum.12879
Kruskal, W. H., & Wallis, W. A. (1952). Use of ranks in one-criterion variance analysis. Journal of the American Statistical Association, 47, 583–621.
Mäkipää, R., Menichetti, L., Martínez-García, E., Törmänen, T., & Lehtonen, A. (2024). Is the organic carbon-to-clay ratio a reliable indicator of soil health? Geoderma, 444, 116862. https://doi.org/10.1016/j.geoderma.2024.116862
Poeplau, C., & Don, A. (2023). A simple soil organic carbon level metric beyond the organic carbon-to-clay ratio. Soil Use and Management, 39(3), 1057–1067. https://doi.org/10.1111/sum.12921
Prout, J. M., Shepherd, K. D., McGrath, S. P., Kirk, G. J. D., & Haefele, S. M. (2021). What is a good level of soil organic matter? An index based on organic carbon to clay ratio. European Journal of Soil Science, 72, 2493–2503. https://doi.org/10.1111/ejss.13012
Sadovski, A., & Ivanova, [initials to add] (2020). [Full reference to add: Kachinsky-to-international clay conversion].
Sauzet, O., Johannes, A., Deluz, C., Dupla, X., Matter, A., Baveye, P. C., & Boivin, P. (2024). The organic carbon-to-clay ratio as an indicator of soil structure vulnerability, a metric focused on the condition of soil structure. Soil Use and Management, 40, e13060. https://doi.org/10.1111/sum.13060
Spearman, C. (1904). The proof and measurement of association between two things. American Journal of Psychology, 15, 72–101.
Shamrikova, E. V., et al. (2022). Problems and Limitations of the Dichromatometric Method for Measuring Soil Organic Matter Content: A Review. Eurasian Soil Science, 55, 861–867.