
Directive reference – Annex I Part A
Ratio 1/13; humus to SOC conversion; clay conversion; Bulgarian Vertisols
SOC/clay indicator (1/13) in Bulgarian Vertisols: analysis of 87 historical profiles – Case Study
Study area
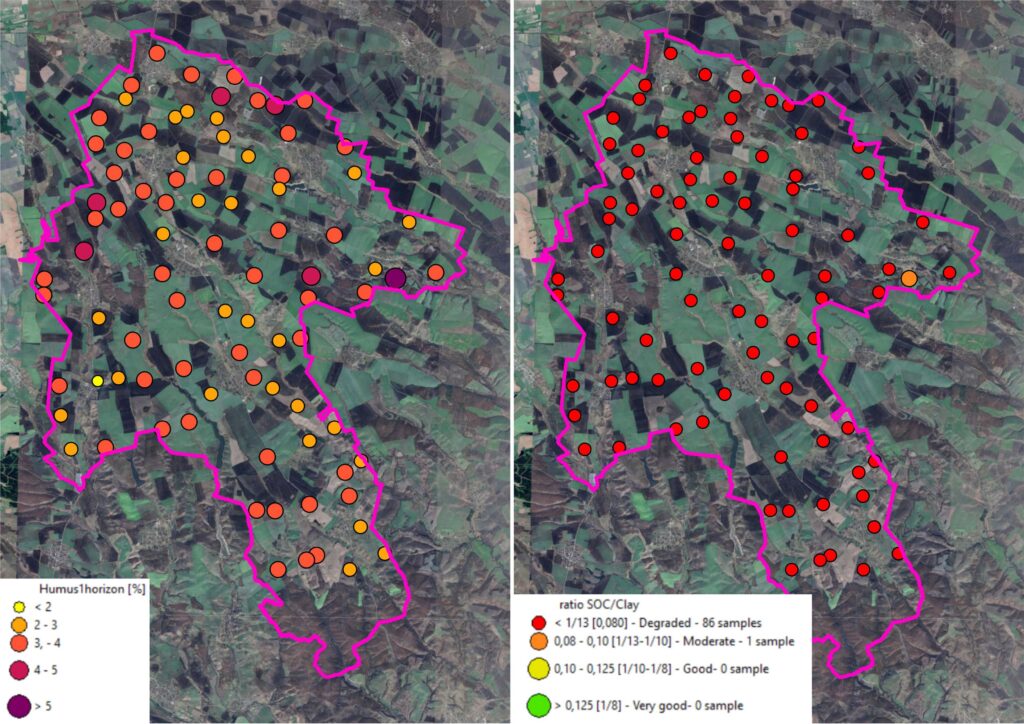
The profiles come from the historical soil surveys located in eastern Upper Thracian Lowland in southern Bulgaria. Local data classify most of the ground as Vertisols (Eutric Vertisols & lepti-eutric Vertisols), while the EU soil map shows Chromic Luvisols.
| Attribute | Description |
| Relief | Flat to gently hilly; eastern part of the Upper Thracian Lowland |
| Elevation | 140–165 m a.s.l. |
| Climate | Transitional-continental; mild winters, hot summers, quick spring warming. Mean annual rainfall about 550 mm, unevenly distributed; a summer water deficit and frequent drought stress for soils and crops |
| Soils, local data | More than 82% Vertisols on impermeable Pliocene sediments, heavy-textured and clay-rich; about 12% Fluvisols along river beds; about 6% Luvisols on the hillier parts |
| Soils, EU soil map | Chromic Luvisols; parent material given as Mesozoic and Tertiary sedimentary rocks, clayey and loamy Quaternary eluvium |
| Land use | Intensive farming; a classic arable region |
Data and sample
The data set has 87 profiles – each row describes the first horizon, 25–32 cm deep (61 profiles at 30 cm, 16 at 25 cm), so it is a 0–30 cm layer rather than the 0–20 cm topsoil used in the JRC benchmarking study.
| Variable | Used for | Min | Median | Max |
| Humus, % (Tyurin) | SOC | 1.76 | 3.19 | 5.86 |
| pH (H2O) | Description | 5.15 | 7.30 | 7.90 |
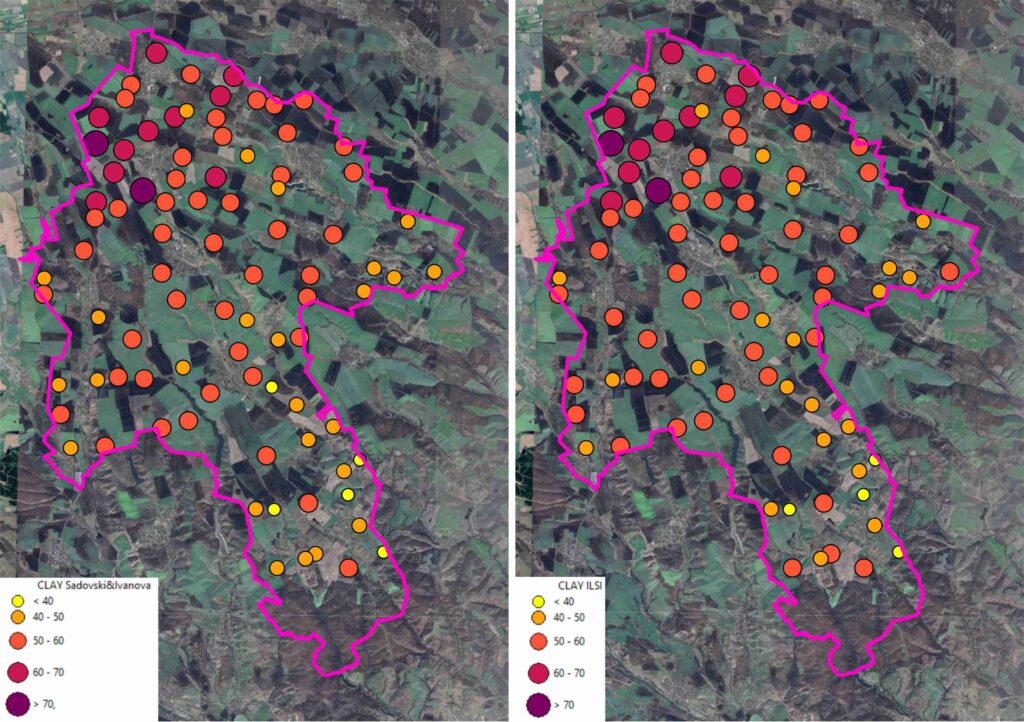
| Clay, % (LLSI conversion, <0.002 mm) | Ratio denominator | 31.9 | 53.7 | 71.0 |
| Clay, % (Sadovski & Ivanova) conversion | Sensitivity check | 30.5 | 52.0 | 71.0 |
| SOC, % (humus / 1.724 × 1.15) | Ratio numerator | 1.17 | 2.13 | 3.91 |
| First horizon depth, cm | Description | 25 | 30 | 32 |
Two clay estimates are available – LLSI (log-linear sectional interpolation; column clay_ILSI) and Sadovski & Ivanova. LLSI is higher than the Sadovski & Ivanova value in 66 profiles, by up to 2.9 percentage points.
The median of profile soil depth is 99.5 cm.
Methods
SOC and clay are both in % of fine-earth mass, so the ratio is dimensionless. The calculation chain follows the source file:
SOC_{Tyurin} = \frac{Humus}{1.724}
SOC_{corr} = f \cdot SOC_{Tyurin}, \quad f = 1.15
R = \frac{SOC_{corr}}{Clay_{<0.002\,mm}}
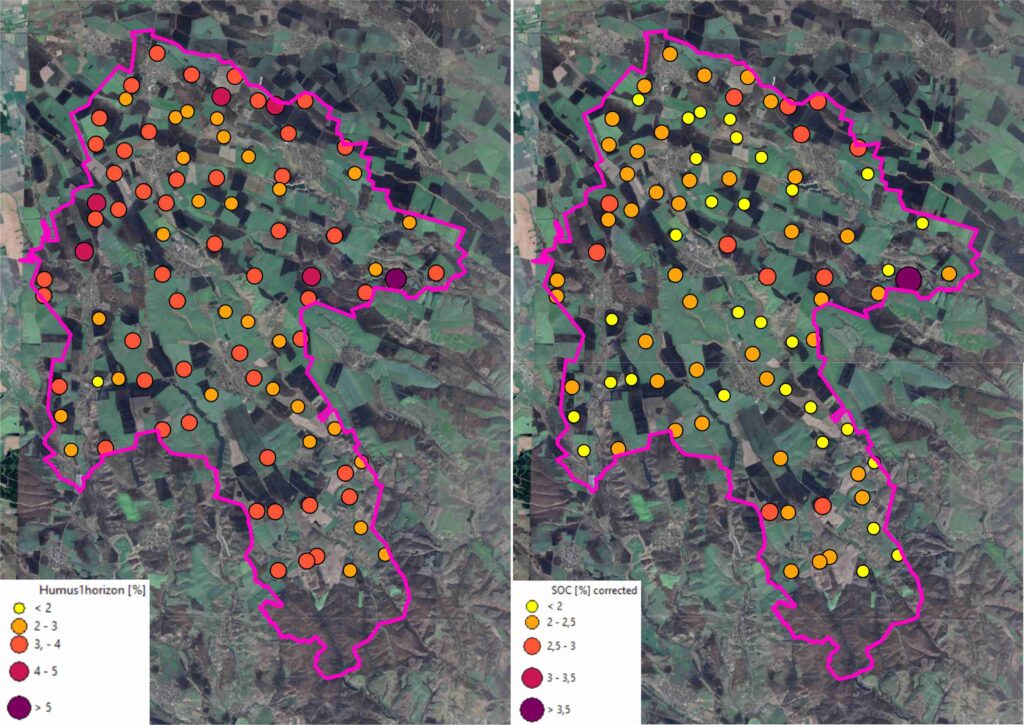
The Directive’s criterion for managed mineral soils is R > 1/13 (0.0769). The four classes (very good ≥ 1/8; good 1/10 to < 1/8; moderate 1/13 to < 1/10; degraded < 1/13) come from the literature (Johannes et al. 2017; Prout et al. 2021), not from the Directive.
Four quantities show how far each profile is from the threshold:
SOC_{needed} = \frac{Clay}{13}, \quad Humus_{needed} = \frac{SOC_{needed}}{f} \cdot 1.724, \quad f_{needed} = \frac{SOC_{needed}}{SOC_{Tyurin}}, \quad Clay_{max} = 13 \cdot SOC_{corr}
Sensitivity scenarios vary one input at a time and then combine the favourable ones:
- Tyurin factor f = 1.15 (source file) against f = 1.0 (no recovery correction).
- LLSI clay (source file) against Sadovski clay, and against the lower of the two.
- A hypothetical multiplier m on SOC (1.1 to 1.5) to represent a 0–20 cm layer richer in carbon than the 0–30 cm layer. This is an illustration, not a measurement.
Results
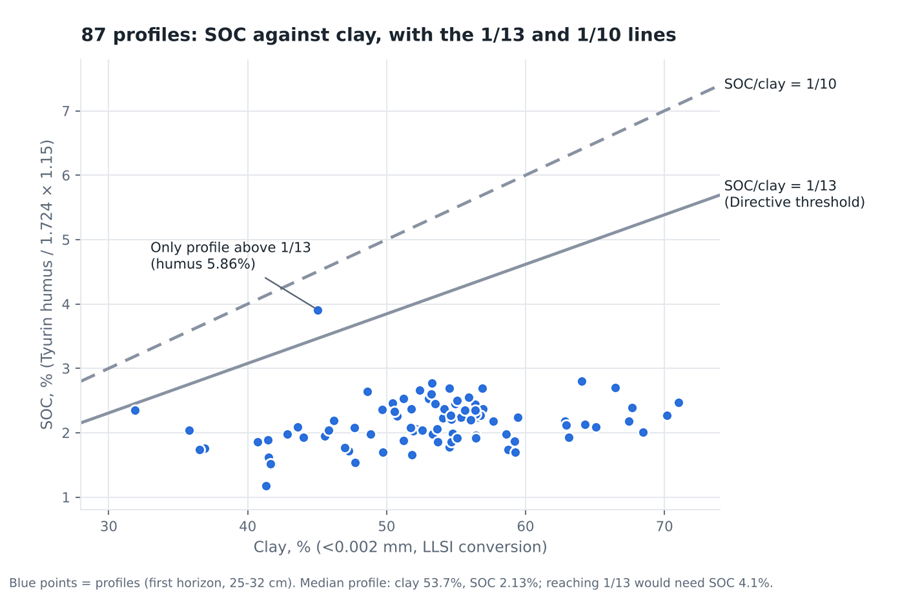
One of 87 profiles (1.1%; Clopper–Pearson 95% interval 0.0–6.2%) is above 1/13.
| Class (literature scale) | Ratio | Profiles |
| Very good | ≥ 1/8 | 0 |
| Good | 1/10 to < 1/8 | 0 |
| Moderate | 1/13 to < 1/10 | 1 |
| Degraded | < 1/13 | 86 |
The median ratio is 0.0404 (bootstrap 95% CI 0.0387–0.0422). The quartiles are 0.0349 and 0.0457, the 5th and 95th percentiles 0.0308 and 0.0516, and the range 0.0284–0.0868.
Distance from the threshold. The table gives, for each profile, what it would need to reach 1/13, against what it has.
| Quantity | Median needed | Range needed | Median observed |
| SOC, % | 4.13 | 2.45–5.46 | 2.13 |
| Humus, % (at f = 1.15) | 6.19 | 3.68–8.19 | 3.19 |
| Tyurin factor f | 2.19 | 1.02–3.11 | 1.15 applied |
| Clay, % | ≤ 27.7 | ≤ 15.3 to ≤ 50.8 | 53.7 |
Fifty-nine of 87 profiles would need f above 2, and 85 would need f above 1.5. Only one profile has humus at or above its own requirement.
SOC and clay. SOC rises by 0.013 percentage points per percentage point of clay (R² = 0.075; bootstrap 95% CI of the slope 0.003–0.023). On the log–log scale the slope is 0.37 (95% CI 0.13–0.63): doubling clay raises SOC by about 29%. With a slope of 1, SOC would be proportional to clay and the ratio constant. Because the slope is lower, the ratio falls with clay (Spearman −0.50, p < 0.001) and rises with SOC (0.60, p < 0.001).
| Clay class, % | Profiles | Median ratio | Highest ratio |
| ≤ 40 | 4 | 0.052 | 0.074 |
| 40–50 | 21 | 0.044 | 0.087 |
| 50–60 | 50 | 0.040 | 0.052 |
| > 60 | 12 | 0.033 | 0.044 |
Even in the lowest clay class the median is below 1/13. pH does not explain the ratio (Spearman −0.12, p = 0.28), unlike in the French monitoring network where acidic soils passed more often.
Sensitivity analysis
No tested combination of factors changes the conclusion: at most 3 of 87 profiles pass 1/13, even in the most favourable scenario.
| Scenario | Profiles ≥ 1/13 |
| f = 1.15, LLSI clay (source file) | 1 |
| f = 1.0, LLSI clay | 0 |
| f = 1.0, Sadovski clay | 1 |
| f = 1.15, Sadovski clay | 2 |
| f = 1.15, lower of the two clay values | 2 |
| f = 1.15, LLSI clay, SOC × 1.1 (hypothetical) | 2 |
| f = 1.15, LLSI clay, SOC × 1.3 (hypothetical) | 2 |
| f = 1.15, LLSI clay, SOC × 1.5 (hypothetical) | 5 |
| f = 1.15, lower clay, SOC × 1.3 (hypothetical) | 3 |
The multiplier on SOC is the scenario to read with care. It stands for the possibility that a 0–20 cm layer holds more carbon than the 0–30 cm layer in the file. The median profile would need SOC 1.90 times higher (range 0.89–2.71) to reach 1/13, and only 5 profiles would need 1.5 or less. A difference that large between a 20 cm and a 30 cm layer would be unusual, but the file cannot test it. Within the file, profiles with a 30 cm first horizon have higher SOC than those with a thinner one (median 2.23% against 1.94%; Spearman 0.26, p = 0.014), so the depth effect cannot be read from these data.
The Tyurin factor and the clay conversion move individual profiles across the line at the edges, but not the population. The median profile stays below the threshold in every scenario, from 46% of it (f = 1.0) to 79% at the largest multiplier (median R = 0.0606, about 1/16.5, at × 1.5).
Discussion
The 1/13 threshold cannot be reached by almost any of these Vertisols, and the cause lies mainly in how the ratio is built, not in the Tyurin factor or the clay conversion.
Why the ratio behaves this way. For a given SOC, the ratio falls in proportion to clay. In these soils SOC rises only weakly with clay (log–log slope 0.37), so clay-rich soils are pushed into the degraded class. The same pattern has been reported elsewhere: the share of degraded soils rises steeply with clay in the German inventory (Poeplau & Don 2023); the threshold is inadequate outside the SOC and clay range used to derive it (Mäkipää et al. 2024); some pedoclimatic contexts in France will never reach it (INRAE); clay explained little of SOC in Lower Austria (Wenzel et al. 2024); and the threshold is judged too high for clay-rich Mediterranean soils (IUSS commentary).
The counter-argument. Sauzet et al. (2024) present the ratio as a structure vulnerability indicator, not a carbon target, and report that in clayey Swiss cropland the SOC–clay relationship held across the clay range, so 1:10 may remain useful there. The 87 Vertisols do not show that proportional relationship, but they are a different population with a narrower and higher clay range, and the file has no structure data. The two views are therefore not tested against each other here.
A Vertisol-specific hypothesis, not tested. Shrink–swell cracking and self-mulching may give these soils a structure that depends less on SOC than in other soils, and cracking may carry organic matter below the sampled layer. Both would make a topsoil SOC/clay ratio a poor guide to structural condition. Testing this needs SOC stocks to 100 cm and a structure measurement on a subset of profiles.
What the data support. Three statements: 1/13 is practically unreachable for this population; the result holds across the tested methods; and the Directive itself expects corrective factors for specific soil types, so a Vertisol case falls within its design. What they do not support: that the soils are healthy, that any particular corrective factor is right, or that the pattern holds for Vertisols outside this sample.
Options for a corrective approach, each needing evidence beyond this file:
- A Vertisol-specific threshold derived from reference sites (for example long-term grassland on the same soils).
- A benchmark against typical SOC for the pedoclimatic zone (the JRC O/T SOC approach).
- SOC:SOCexp within the soil group, as used here as a screening tool.
- Keeping SOC/clay as a screen but pairing it with a structure measure before classing a soil as degraded.
Limitations. The 87 profiles comes from the eastern Upper Thracian Lowland (about 550 mm rainfall, summer water deficit), the result says nothing about Vertisols under other climates. The Tyurin factor of 1.15 is a literature value, not a calibration against dry combustion. The Kachinsky protocol often does not remove organic matter before particle-size analysis, which tends to understate clay and so raises the ratio; this works in favour of passing, so it cannot explain the failures.
References
- Directive (EU) 2025/2360 on soil monitoring and resilience, Annex I (EUR-Lex)
- Johannes et al. 2017. Optimal organic carbon values for soil structure quality of arable soils. Does clay content matter?
- Prout, Shepherd, McGrath, Kirk & Haefele 2021. What is a good level of soil organic matter? An index based on organic carbon to clay ratio. Eur. J. Soil Sci. 72: 2493–2503
- Poeplau & Don 2023. A simple soil organic carbon level metric beyond the organic carbon-to-clay ratio. Soil Use Manage.
- Sauzet et al. 2024. The organic carbon-to-clay ratio as an indicator of soil structure vulnerability. Soil Use Manage. 40(2)
- Mäkipää et al. 2024. Is the organic carbon-to-clay ratio a reliable indicator of soil health? Geoderma 444: 116862
- Wenzel, Golestanifard & Duboc. SOC:clay ratio: a mechanistically-sound, universal soil health indicator across ecological zones and land use categories? Geoderma
- INRAE. Relevance of the organic carbon to clay ratio as a national soil health indicator
- JRC. Benchmarking soil organic carbon (SOC) concentration provides more robust soil health assessment than the SOC/clay ratio at European scale
- IUSS. The European Law on Soil Monitoring
- Nikorych 2025. Bridging the gap between Kachinsky and FAO/USDA particle-size distribution systems. Biological Systems 17(3)
- Sadovski & Ivanova 2020. Transformation of soil texture schemes and determination of water-physical properties of soils. Eurasian J. Soil Sci. 9(4): 306–313